I added Grafana dashboard on my Domoticz data
it’s a nice addition and provides more information over time.
The information displayed, is (some examples) the current Energy usage, the usage over a specified time, Current Temperatures in Livingroom, attic, Outside etc. And those are also shown over a specified period.
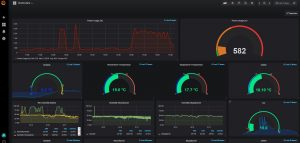
The Grafana dashboard is based on the influx database for IOT devices.
Grafana offers lots of additional possibilities, as a result i also added a Synology NAS Dashboard and a dashboard to monitor the Raspberry Pi that Grafana and InfluxDB are running on.