Video and audiobooth with Raspberry pi 3b

Building a videobooth and photobooth in one using the Raspberry Pi3b.
I wanted to build a Videobooth for a weekend with kids from school, so they can record video messages and photos that can be used in the movie of the weekend.

During my research I found a lot of Photobooth solution but no Videobooth.

Eventually I made a hybrid solution with.
1. Picam, adding a webcam mircophone for audio https://github.com/iizukanao/picam
2. Raspistill for taking a photo.

The advantage of picam is that video and audio don’t have synchronisation issues.

I also wanted a multi input solution.
1. Screen
2. Button to start recording or taks picture.

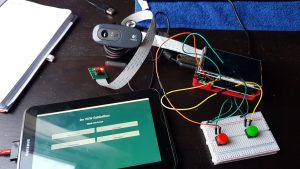
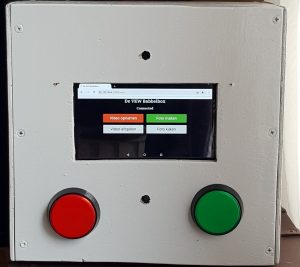
A working concept is shown below.
It is a work in progress that needs to be ready end of may 2019.

The 3,5 inch LCD display seems to small, so using a 7 inch tablet (therefor the pi is configured as access point) will probably the solution.

Front and backend are programmed using Python. Flask is used for webfront. Tkinter for normal GUI.

Flask on Raspberry Pi and starting the flask app on startup

After creating a working flask app on my laptop, which uses the library Matplotlib, i moved the app to my raspberry.

The app itself worked , but the matplotlib plot did not show, due to a parameter that was used : pad = none in plt.title. This did not give an issue on my laptop but it did on the pi. Removing this solved the issue.

Another issue I needed to tackle was starting the app at reboot. My first option of using the script start in : crontab -e did not work. The app was not started. using this command: python3 /var/www/warmte/xxx.py &

Moving the line to rc.local did the job:

  • sudo nano /etc/rc.local
  • add the line: python3 /var/www/warmte/xxx.py &  before the exit 0

PiHole Experiabox V10 toont alsnog advertenties

Post in Nederlands i.v.m. issue Experiabox.

Na installatie van PiHole en het aanpassen van de DNS server in de Experiabox V10 (ZTE H369A) bleek dat er alsnog advertenties doorgelaten worden.

Na onderzoek bleek dat de IPv6 routeringen het e.e.a. alsnog doorlaten. Er blijkt helaas in de DNS geen IPV6 DNS in te stellen. Dat laat een aantal mogelijkheden.

  1. De DHCP van PiHole gebruiken
  2. De IPV6 instellingen op elk apparaat uitzetten
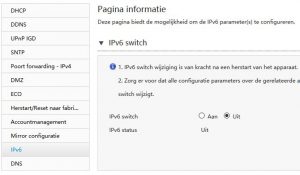
  3. De IPV6 switch in de experiabox uitzetten.

Voor nu heb ik voor het laatste gekozen.

Raspberry Pi move log to RAM

In order to lower the number of writes to the SD-card, it is wise to move the log life to a tmpfs mount in RAM.

i found this site that explains how to do it: https://domoticproject.com/extending-life-raspberry-pi-sd-card/

As a result of this , the MQTT service running on my Domoticz Pi, raised an error. Error: MQTT: Failed to start, return code: 14 (Check IP/Port)

Apperantly the dir /var/log/mosquitto can not be created on RAM .

A suggested solution that I need to test is in: https://www.raspberrypi.org/forums/viewtopic.php?t=34820

Scrape Javascript heavy website on RaspberryPi3B+ using Python with Selenium

When I was trying to scrape a Javascript heavy website with my Raspberry using Python, I ran into some interesting issues that needed to be solved.

I found that modules like request,request_html, urlllib did not deliver the complete content with Javascripts websites containing shadow-dom (#shadowroot). When searching for solution i found some, like the use of PhantomJS or other discontinued modules.

The solution I found was using Chromedriver in headless mode. But the version I got my hands on kept throwing errors on the version of the browser.

After extensive searches I found the solution in:

1. Download the latest chromedriver from:

https://github.com/electron/electron/releases

(get the arvmv7 version)

2. Install this using the instructions i found on:

https://www.raspberrypi.org/forums/viewtopic.php?t=194176

  • mkdir /tmp
  • wget <url latest version arm7>
  • unzip <zip file>
  • mv chromedriver /usr/local/bin
  • sudo chmod +x /usr/local/bin/chromedriver
    sudo apt-get install libminizip1
    sudo apt-get install libwebpmux2
  • sudo apt-get install libgtk-3-0

In your code add these two arguments, when you start the driver:
-headless
-disable-gpu

3 Update the Chromium bowser

When trying to execute the script I still got the error on Chromium version.I was able to solve that using:

  • sudo apt-get install -y chromium-browser

IT WORKS

now the script finally worked

The Python Script to get the page content

from selenium import webdriver
import time
from selenium.webdriver.common.by import By
from selenium.webdriver.support.ui import WebDriverWait
from selenium.webdriver.support import expected_conditions as EC
from selenium.webdriver.common.keys import Keys
from selenium.webdriver.chrome.options import Options

# Define the site to be opened
site = “http://….”

# Set Chrome Options
chrome_options = Options()
chrome_options.add_argument(“–headless”)
# Open Chrome Headless
driver = webdriver.Chrome(chrome_options=chrome_options)
driver.set_page_load_timeout(20)
driver.get(site)

4. Analyze the content of the page

With the content of the page in driver it is possible to further decompose the page.

content1= driver.find_element_by_tag_name(‘…..’)
shadow_content1 = expand_shadow_element(content1)

To get access to the shadow element the function below needs to be used:

# function to expand a shadow element to useable content
def expand_shadow_element(element):
shadow_root = driver.execute_script(‘return arguments[0].shadowRoot’, element)
return shadow_root
Grafana Stability Raspberry Pi 3B+ issues

Unfortunately it seems that the Grafana stack with Influxdb and Telegraph is not stable enough on my raspberry pi.

An issue that could cause this, is the SD-card , it’s speed and durability.

Even after disabling Grafana. the pi running that , which i also used as a webserver, crashes. So a conclusion at this time is that de SD card is having some issues. New higher speed SD-card has been ordered. Until then , the Grafana portal has gone offline unfortunately.

Grafana Dashboards added

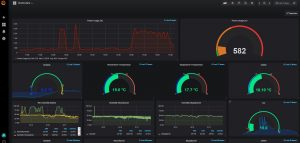
I added Grafana dashboard on my Domoticz data

it’s a nice addition and provides more information over time.

The information displayed, is (some examples) the current Energy usage, the usage over a specified time, Current Temperatures in Livingroom, attic, Outside etc. And those are also shown over a specified period.

The Grafana dashboard is based on the influx database for IOT devices.

Grafana offers lots of additional possibilities, as a result i also added a Synology NAS Dashboard and a dashboard to monitor the Raspberry Pi that Grafana and InfluxDB are running on.